English Online Help Topic Quick start manual
5 Quick start manual
|
1.) |
|
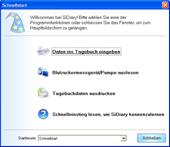
When you start SiDiary for the very
first time, the profile wizard will open and ask you some diabetes-related
questions to configure the software especially for your individual needs.
After that you get into the quick start screen, where you can find the most
important functions: manual data entry, readout meter and print logbook. |
|
2.) |
|
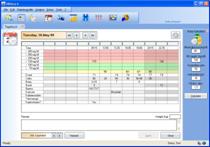
You can start immediately with tracking
your data. Click on the grid at any place and enter the related value. (Blood
glucose levels will be re-ordered to the appropriate row automatically) With
the cursor buttons above the grid you can navigate to the next day, the previous
day or week – or you can open the calendar by double clicking on the date to
choose the exact day you want. |
|
3.) |
|
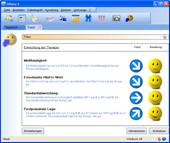
When you have tracked some readouts,
you can use the trend display to see a rating and a trend of your current
condition. Please open the Menu Analysis → Trend or press the
F5-button. Of course the results will become more significant with more tracked
data! All limit values for the ratings can be predefined with your own
individual settings (button Settings). |
|
4.) |
|
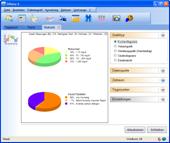
You
can analyze your entered or imported data (from blood glucose meters, insulin
pumps, blood pressure meters etc.) with detailed statistical graphics. You are
able to set several filters, define control times and select graphic types. Therefore
you can analyze and answer any tricky questions. With the cursor buttons in
the time range your can switch the adjusted time range to an equal time range
in order to compare for example different weeks with each other. |